Elite Education Group International Ltd Shares Close the Week 49.4% Higher - Weekly Wrap
The company saw its shares close the week 49.4% higher than last week, with trading volume higher than its 30 day average.
Sep 18, 2021 by Kwhen Finance Editors
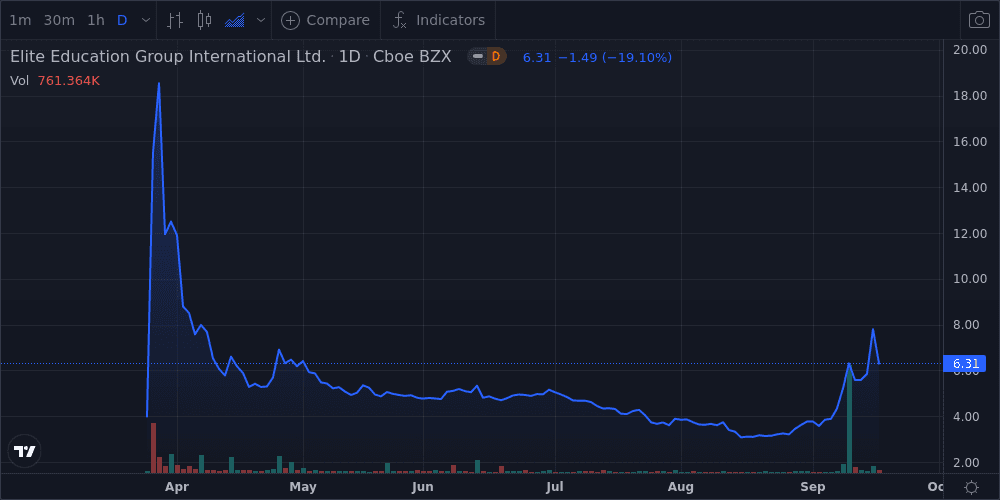
Elite Education Group International Ltd (EEIQ) shares closed this week 49.4% higher than it did at the end of last week. The stock is currently up 95.0% year-to-date, up 95.0% over the past 12 months, and up 95.0% over the past five years. This week, the Dow Jones Industrial Average fell 0.3%, and the S&P 500 fell 0.4%.
Trading Activity
- Shares traded as high as $7.94 and as low as $5.00 this week.
- Shares closed 82.1% below its 52-week high and 116.8% above its 52-week low.
- Trading volume this week was 67.0% lower than the 10-day average and 9.5% lower than the 30-day average.
- Beta, a measure of the stock’s volatility relative to the overall market stands at 0.0.
Technical Indicators
- The Relative Strength Index (RSI) on the stock was between 30 and 70.
- MACD, a trend-following momentum indicator, indicates an upward trend.
- The stock closed below its Bollinger band, indicating it may be oversold.
- The stock closed at 1.3% higher than its 5-day moving average, 42.0% higher than its 20-day moving average, and 41.3% higher than its 90-day moving average.
Market Comparative Performance
- The company's share price beats the S&P 500 Index this week, beats it on a 1-year basis, and lags it on a 5-year basis
- The company's share price beats the Dow Jones Industrial Average this week, beats it on a 1-year basis, and lags it on a 5-year basis
| Name | DoD %Δ | YTD %Δ | 1 Yr % | 52-Week H % | 52-Week L % |
|---|---|---|---|---|---|
| Elite Education Group International Ltd | -19.1 | 95.0 | 95.0 | -78.8 | 156.0 |
| Dow Jones Industrial Average | -0.7 | 15.1 | 26.1 | -2.6 | 34.6 |
| S&P 500 Index | -1.3 | 20.4 | 33.9 | -2.0 | 40.6 |
| Technology Industry | 4.6 | -53.0 | -71.2 | -74.7 | 4.6 |
Peer Group Comparative Performance
- The company's stock price performance year-to-date beats the peer average by 17.9%
- The company's stock price performance over the past 12 months lags the peer average by -31.6%
| Name | MKT CAP (USD) | P/E | YTD %Δ | 1 Yr %Δ | 52-Week H % | 52-Week L % |
|---|---|---|---|---|---|---|
| Elite Education Group International Ltd | EEIQ | 0 | 95.0 | 95.0 | -78.8 | 156.0 |
| Peer Avg | N/A | 0 | 80.6 | 138.9 | -0.0 | 206.9 |
| Houghton Mifflin Harcourt Co | HMHC | 0 | 322.2 | 555.5 | -0.1 | 827.5 |
This story was produced by the Kwhen Automated News Generator. For more articles like this, please visit us at finance.kwhen.com. Write to editors@kwhen.com. © 2021 Kwhen Inc.
Was this content valuable for you?
Tags: