Cenovus Energy Inc Shares Approach 52-Week High - Market Mover
The shares closed 1.7% below its 52-week high of $20.47, with trading volume higher than its 30 day average
May 13, 2022 by Kwhen Finance Editors
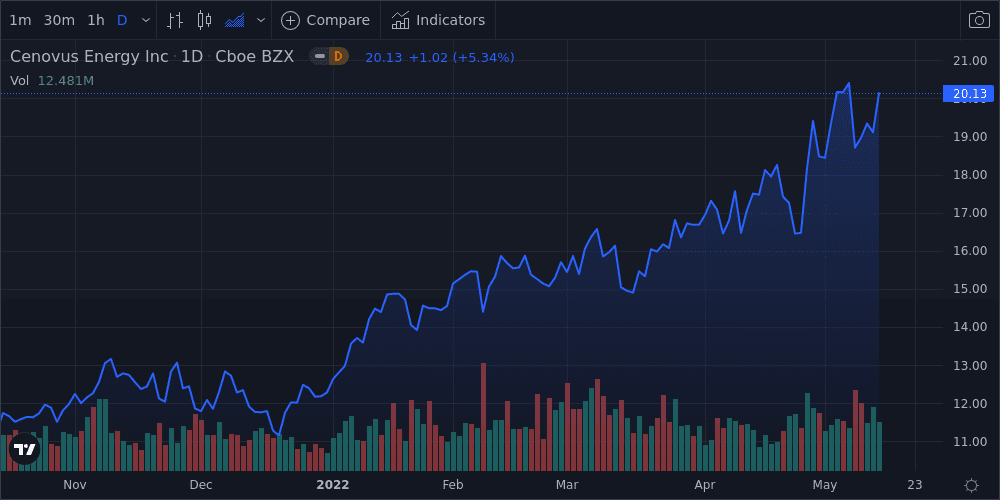
Cenovus Energy Inc (CVE) shares closed today at 1.7% below its 52 week high of $20.47, giving the company a market cap of $39B. The stock is currently up 64.2% year-to-date, up 152.1% over the past 12 months, and up 125.5% over the past five years. This week, the Dow Jones Industrial Average fell 2.1%, and the S&P 500 fell 2.3%.
Trading Activity
- Trading volume this week was 25.6% higher than the 20-day average.
- Beta, a measure of the stock’s volatility relative to the overall market stands at 1.0.
Technical Indicators
- The Relative Strength Index (RSI) on the stock was between 30 and 70.
- MACD, a trend-following momentum indicator, indicates an upward trend.
- The stock closed below its Bollinger band, indicating it may be oversold.
Market Comparative Performance
- The company's share price is the same as the S&P 500 Index , beats it on a 1-year basis, and beats it on a 5-year basis
- The company's share price is the same as the Dow Jones Industrial Average , beats it on a 1-year basis, and beats it on a 5-year basis
- The company share price is the same as the performance of its peers in the Energy industry sector , beats it on a 1-year basis, and beats it on a 5 year basis
| Name | DoD %Δ | YTD %Δ | 1 Yr % | 52-Week H % | 52-Week L % |
|---|---|---|---|---|---|
| Cenovus Energy Inc | 5.3 | 64.2 | 152.1 | -4.7 | 172.3 |
| Dow Jones Industrial Average | 1.4 | -10.9 | -3.7 | -12.9 | 2.5 |
| S&P 500 Index | 2.4 | -15.2 | -0.8 | -17.1 | 3.0 |
| Energy | 3.6 | 42.2 | 53.6 | -4.9 | 75.1 |
Peer Group Comparative Performance
- The company's stock price performance year-to-date beats the peer average by 97.6%
- The company's stock price performance over the past 12 months beats the peer average by 202.0%
| Name | MKT CAP (USD) | P/E | YTD %Δ | 1 Yr %Δ | 52-Week H % | 52-Week L % |
|---|---|---|---|---|---|---|
| Cenovus Energy Inc | CVE | 0 | 64.2 | 152.1 | -4.7 | 172.3 |
| Peer Avg | N/A | 8.1 | 32.5 | 50.4 | -6.9 | 78.7 |
| EOG Resources, Inc. | EOG | 16.6 | 43.0 | 58.9 | -7.3 | 105.2 |
| Canadian Natural Resources Ltd. | CNQ | 9.5 | 45.4 | 84.5 | -17.1 | 104.7 |
| Suncor Energy, Inc. | SU | 9.3 | 46.7 | 62.9 | -5.2 | 117.4 |
| Phillips 66 | PSX | 17.9 | 31.9 | 12.9 | -4.2 | 50.0 |
| Imperial Oil Limited | IMO | 12.9 | 38.7 | 59.6 | -11.2 | 105.1 |
| Marathon Oil Corporation | MRO | 8.9 | 65.0 | 132.1 | -11.0 | 149.5 |
| APA Corporation | APA | 5.6 | 54.1 | 92.9 | -13.3 | 154.8 |
This story was produced by the Kwhen Automated News Generator. For more articles like this, please visit us at finance.kwhen.com. Write to editors@kwhen.com. © 2021 Kwhen Inc.
Was this content valuable for you?
Tags: