Empire State Realty OP LP Series 60 Shares Close the Day 17.1% Lower - Daily Wrap
The company saw its shares close the day 17.1% lower than yesterday, with trading volume lower than its 30 day average.
Nov 30, 2021 by Kwhen Finance Editors
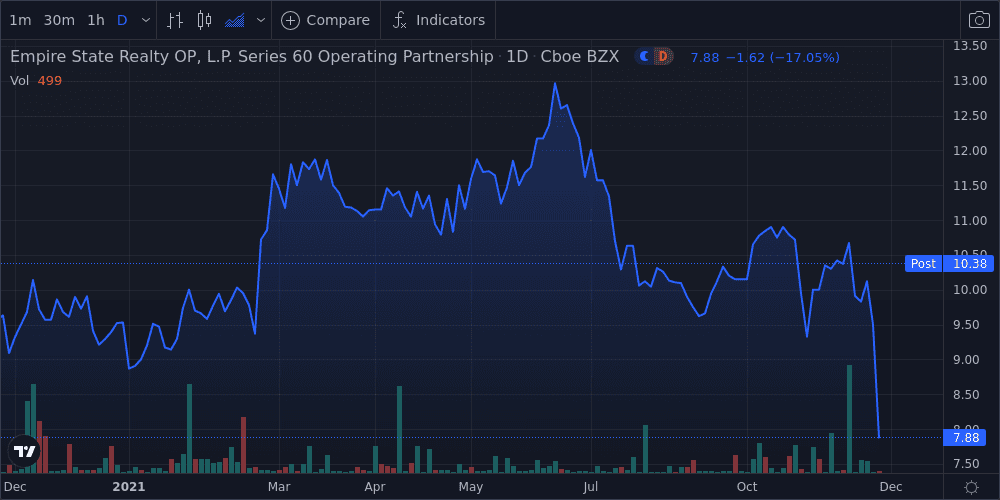
Empire State Realty OP LP Series 60 (OGCP) shares closed today 17.1% lower than it did at the end of yesterday. The stock is currently up 0.0% year-to-date, down 1.0% over the past 12 months, and down 48.0% over the past five years. Today, the Dow Jones Industrial Average rose 0.6%, and the S&P 500 rose 1.2%.
Trading Activity
- Shares traded as high as $10.67 and as low as $9.50 this week.
- Shares closed 39.2% below its 52-week high and 3.9% below its 52-week low.
- Trading volume this week was 96.8% lower than the 10-day average and 98.6% lower than the 30-day average.
- Beta, a measure of the stock’s volatility relative to the overall market stands at 0.0.
Technical Indicators
- The Relative Strength Index (RSI) on the stock was between 30 and 70.
- MACD, a trend-following momentum indicator, indicates a downward trend.
- The stock closed below its Bollinger band, indicating it may be oversold.
Market Comparative Performance
- The company's share price lags the S&P 500 Index today, lags it on a 1-year basis, and lags it on a 5-year basis
- The company's share price lags the Dow Jones Industrial Average today, lags it on a 1-year basis, and lags it on a 5-year basis
- The company share price lags the performance of its peers in the Financials industry sector today, lags it on a 1-year basis, and lags it on a 5 year basis
| Name | DoD %Δ | YTD %Δ | 1 Yr % | 52-Week H % | 52-Week L % |
|---|---|---|---|---|---|
| Empire State Realty OP LP Series 60 | -17.1 | 0.0 | -1.0 | -30.5 | 9.8 |
| Dow Jones Industrial Average | 0.6 | 15.9 | 18.6 | -3.4 | 21.7 |
| S&P 500 Index | 1.2 | 24.0 | 28.0 | -2.0 | 31.0 |
| Financials | 0.4 | 30.7 | 35.3 | -3.4 | 39.7 |
Peer Group Comparative Performance
- The company's stock price performance year-to-date lags the peer average by -99.7%
- The company's stock price performance over the past 12 months lags the peer average by -104.1%
| Name | MKT CAP (USD) | P/E | YTD %Δ | 1 Yr %Δ | 52-Week H % | 52-Week L % |
|---|---|---|---|---|---|---|
| Empire State Realty OP LP Series 60 | OGCP | 0 | 0.0 | -1.0 | -30.5 | 9.8 |
| Peer Avg | N/A | -2.1 | 18.9 | 24.6 | -7.2 | 27.6 |
| Omega Healthcare Investors, Inc. | OHI | 15.1 | -16.6 | -15.5 | -24.1 | 2.4 |
| Office Properties Income Trust | OPI | -43.9 | 16.4 | 10.9 | ||
| One Liberty Properties, Inc. | OLP | 20.5 | 75.8 | 103.2 | -4.6 | 107.8 |
This story was produced by the Kwhen Automated News Generator. For more articles like this, please visit us at finance.kwhen.com. Write to editors@kwhen.com. © 2021 Kwhen Inc.
Was this content valuable for you?
Tags: