Utilities and Health Care Stocks Lead U.S Stock Market Rise - U.S Daily Sector Wrap
Stocks rose 0.5% today led by the 2.2% gain in Utilities stocks and the 1.4% gain in Health Care, while Technology stocks performed worst with a 2.8% decline
Apr 07, 2022 by Kwhen Finance Editors
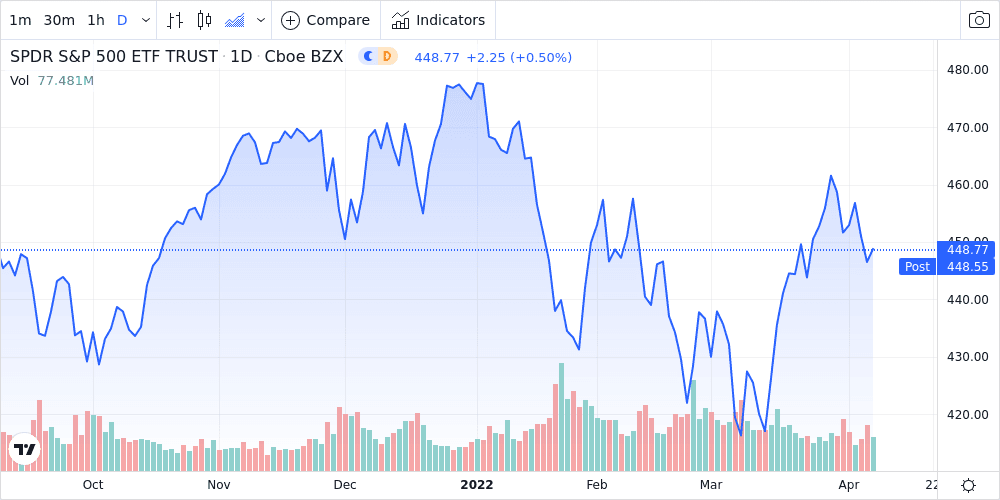
U.S. stocks rose by 0.5% today fueled by a 2.2% increase in utilities stocks and a 1.4% increase in health care stocks. Utilities stocks are currently up 6.5% year-to-date, and up 19.0% over the past 12 months. Health Care stocks are currently down 1.9% year-to-date, and up 17.3% over the past 12 months. Meanwhile, the S&P 500 Index is currently down 5.7% year-to-date, and up 11.5% over the past 12 months. The Dow Jones Industrial Average is currently down 4.7% year-to-date, and up 4.9% over the past 12 months.
Sector Performance
- The S&P 500 Index rose with a 0.5% gain.
- Utilities stocks rose the most with a 2.2% gain.
- Technology stocks fell the most with a 2.8% decline.
- Others sectors that gained include Health Care, Energy and Materials, which rose by an average of 0.5%.
- Others sectors that declined include Industrials, Financials and Real Estate, which fell by an average of -0.9%.
| Name | Ticker | DoD %Δ | YTD %Δ | 1 Yr %Δ | 2 Yr %Δ | 5 Yr %Δ |
|---|---|---|---|---|---|---|
| Market | ||||||
| S&P 500 Index | IVV | +0.49% | -5.7% | +11.5% | +73.0% | +105.6% |
| Gainers | ||||||
| Utilities | IDU | +2.2% | +6.5% | +19.0% | +41.4% | +65.0% |
| Health Care | IYH | +1.4% | -1.9% | +17.3% | +55.0% | +101.5% |
| Energy | IYE | 0.0% | +36.8% | +61.3% | +162.2% | +23.0% |
| Materials | IYM | 0.0% | +5.4% | +16.7% | +114.3% | +79.0% |
| Telecom | IYZ | 0.0% | -9.0% | -7.6% | +20.9% | -2.9% |
| Consumer Staples | XLP | 0.0% | +0.9% | +14.7% | +42.0% | +62.5% |
| Consumer Discretionary | XLY | 0.0% | -11.7% | +4.2% | +82.6% | +117.5% |
| Losers | ||||||
| Technology | IYW | -2.8% | -13.2% | +9.3% | +90.1% | +206.5% |
| Industrials | IYJ | -1.3% | -8.4% | -3.6% | +65.2% | +69.8% |
| Financials | IYF | -0.82% | -4.3% | +9.6% | +72.4% | +72.8% |
| Real Estate | IYR | -0.75% | -4.4% | +20.0% | +66.8% | +61.5% |
Relative Sector Performance
- Relative to the S&P 500 Index, Utilities sector stocks outperformed the most by +1.7%. Health Care sector stocks were the next best performers with a relative outperformance of +0.9%.
- Relative to the S&P 500 Index, Technology sector stocks underperformed the most by -3.3%. Industrials sector stocks were the next worst performers with a relative underperformance of -1.8%.
- Additional sectors that underperformed the S&P 500 Index included Financials, Real Estate and Consumer Discretionary by an average of -1.0%.
| Name | Ticker | DoD %Δ | YTD %Δ | 1 Yr %Δ | 2 Yr %Δ | 5 Yr %Δ |
|---|---|---|---|---|---|---|
| Market | ||||||
| S&P 500 Index | IVV | +0.49% | -5.7% | +11.5% | +73.0% | +105.6% |
| Relative Outperformers | ||||||
| Utilities | IDU | +1.7% | +12.1% | +7.5% | -31.6% | -40.6% |
| Health Care | IYH | +0.91% | +3.7% | +5.9% | -18.0% | -4.1% |
| Relative Underperformers | ||||||
| Technology | IYW | -3.3% | -7.6% | -2.2% | +17.1% | +100.9% |
| Industrials | IYJ | -1.8% | -2.8% | -15.1% | -7.8% | -35.8% |
| Financials | IYF | -1.3% | +1.4% | -1.9% | -0.6% | -32.8% |
| Real Estate | IYR | -1.2% | +1.2% | +8.5% | -6.3% | -44.1% |
| Consumer Discretionary | XLY | -0.49% | -6.0% | -7.3% | +9.6% | +11.9% |
| Consumer Staples | XLP | -0.49% | +6.6% | +3.3% | -31.0% | -43.1% |
| Telecom | IYZ | -0.49% | -3.3% | -19.1% | -52.1% | -108.5% |
| Materials | IYM | -0.49% | +11.0% | +5.2% | +41.3% | -26.5% |
| Energy | IYE | -0.49% | +42.4% | +49.8% | +89.1% | -82.6% |
This story was produced by the Kwhen Automated News Generator. For more articles like this, please visit us at finance.kwhen.com. Write to editors@kwhen.com. © 2021 Kwhen Inc.
Was this content valuable for you?
Tags: