Berkshire Hathaway Inc. - Class B Shares Close in on 52-Week High - Market Mover
The shares closed 0.3% below its 52-week high of $336.32, with trading volume higher than its 30 day average
Jun 09, 2023 by Kwhen Finance Editors
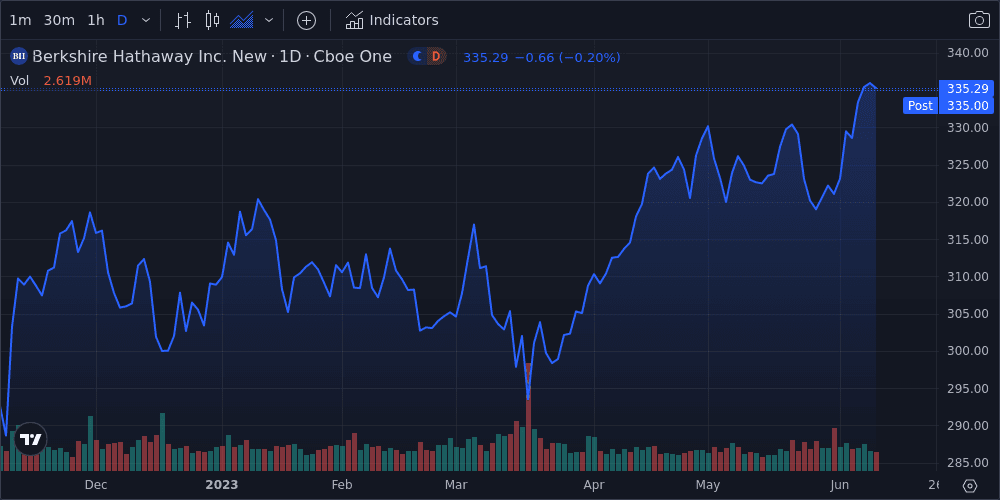
Berkshire Hathaway Inc. - Class B (BRK.B) shares closed today at 0.3% below its 52 week high of $336.32, giving the company a market cap of $735B. The stock is currently up 8.8% year-to-date, up 8.8% over the past 12 months, and up 71.4% over the past five years. This week, the Dow Jones Industrial Average rose 2.4%, and the S&P 500 rose 1.7%.
Trading Activity
- Trading volume this week was 16.2% lower than the 20-day average.
- Beta, a measure of the stock’s volatility relative to the overall market stands at 0.9.
Technical Indicators
- The Relative Strength Index (RSI) on the stock was above 70, indicating it may be overbought.
- MACD, a trend-following momentum indicator, indicates an upward trend.
- The stock closed below its Bollinger band, indicating it may be oversold.
Market Comparative Performance
- The company's share price is the same as the S&P 500 Index , beats it on a 1-year basis, and beats it on a 5-year basis
- The company's share price is the same as the Dow Jones Industrial Average , beats it on a 1-year basis, and beats it on a 5-year basis
- The company share price is the same as the performance of its peers in the Financials industry sector , beats it on a 1-year basis, and beats it on a 5 year basis
| Name | DoD %Δ | YTD %Δ | 1 Yr % | 52-Week H % | 52-Week L % |
|---|---|---|---|---|---|
| Berkshire Hathaway Inc. - Class B | -0.2 | 8.8 | 8.8 | -0.2 | 29.2 |
| Dow Jones Industrial Average | 0.1 | 3.3 | 5.2 | -1.5 | 20.0 |
| S&P 500 Index | 0.2 | 12.6 | 6.1 | 0.1 | 24.5 |
| Financials | -0.0 | -1.2 | -1.4 | -9.6 | 13.3 |
Peer Group Comparative Performance
- The company's stock price performance year-to-date beats the peer average by 224.7%
- The company's stock price performance over the past 12 months beats the peer average by 79.1%
| Name | MKT CAP (USD) | P/E | YTD %Δ | 1 Yr %Δ | 52-Week H % | 52-Week L % |
|---|---|---|---|---|---|---|
| Berkshire Hathaway Inc. - Class B | BRK.B | 0 | 8.8 | 8.8 | -0.2 | 29.2 |
| Peer Avg | N/A | 12.3 | 2.7 | 4.9 | -10.5 | 34.4 |
| Exxon Mobil Corp. | XOM | 7.1 | -0.3 | 7.0 | -8.8 | 39.0 |
| Walmart Inc | WMT | 36.3 | 8.2 | 26.4 | -4.1 | 31.1 |
| Chevron Corp. | CVX | 8.4 | -9.6 | -8.9 | -13.9 | 24.4 |
| Union Pacific Corp. | UNP | 17.5 | -2.3 | -7.6 | -15.2 | 11.3 |
| General Electric Co. | GE | 13.8 | 61.0 | 75.4 | -1.0 | 126.1 |
| 3M Co. | MMM | 10.2 | -13.6 | -27.2 | -30.5 | 9.0 |
| Lee Enterprises, Inc. | LEE | -6.9 | -24.5 | -30.7 |
This story was produced by the Kwhen Automated News Generator. For more articles like this, please visit us at finance.kwhen.com. Write to editors@kwhen.com. © 2021 Kwhen Inc.
Was this content valuable for you?
Tags: