Griffon Corp. Shares Climb 3.9% Past Previous 52-Week High - Market Mover
The shares rose 3.9% higher than its previous 52-week high of $31.02, with trading volume higher than its 30 day average
Aug 08, 2022 by Kwhen Finance Editors
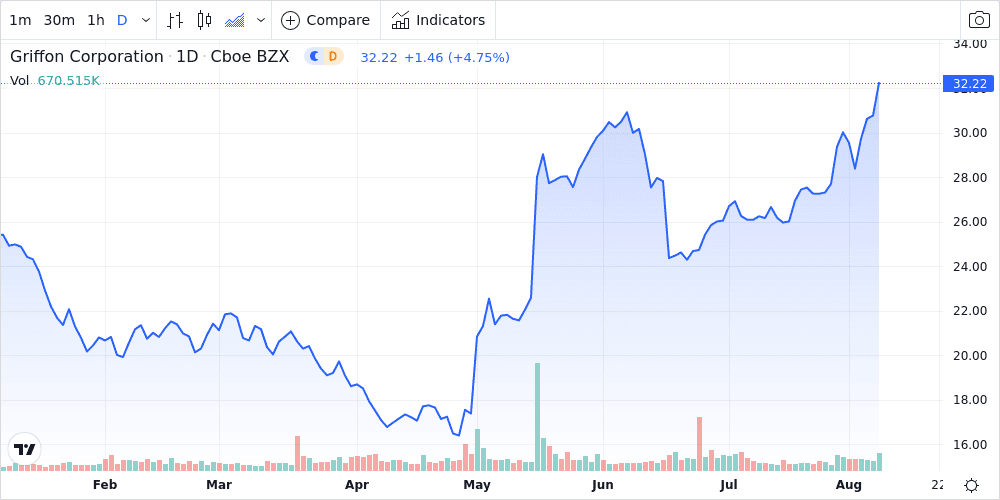
Griffon Corp. (GFF) shares closed 3.9% higher than its previous 52 week high, giving the company a market cap of $1B. The stock is currently up 16.6% year-to-date, up 43.9% over the past 12 months, and up 96.2% over the past five years. This week, the Dow Jones Industrial Average fell 0.2%, and the S&P 500 rose 0.4%.
Trading Activity
- Trading volume this week was 6.5% higher than the 20-day average.
- Beta, a measure of the stock’s volatility relative to the overall market stands at 1.1.
Technical Indicators
- The Relative Strength Index (RSI) on the stock was above 70, indicating it may be overbought.
- MACD, a trend-following momentum indicator, indicates an upward trend.
- The stock closed below its Bollinger band, indicating it may be oversold.
Fundamentals & Catalysts
- Over the past 12 months the company generated $251 million in earnings before interest and taxes from $2 billion in revenue. It currently holds $175 million in cash and $458 million in debt.
- Its forward price-to-earnings (P/E) ratio of 13.885563508508238 is higher than its current P/E ratio of 7.28, implying that analysts are expecting a decrease in earnings.
- The company's price/earnings-to-growth ratio (PEG Ratio), a widely used indicator of a stock's true value while also factoring in expected earnings growth, currently stands at 0.19. A fairly valued company should have a PEG ratio of 1.0. When a company's PEG exceeds 1.0, it's considered overvalued while a stock with a PEG of less than 1.0 is considered undervalued.
- The company's debt-to-equity ratio, which measures the extent to which it finances its operations through debt, currently stands at 3.30 which means it currently has $3.30 of debt for every $1 of equity. Generally speaking, a debt to equity ratio below 1.0 is seen as relatively safe, while ratios of 2.0 or higher would be considered risky. Some industries are known for having much higher debt to equity ratios than others.
- The company's price-to-book ratio, which measures the market's valuation of a company relative to its book value, currently stands at 1.95. This means that the stock is trading at a premium of 2 times relative to the company's book value which reflects the total value of a company's assets that shareholders of that company would receive if the company were to be liquidated.
- The company's price-to-sales ratio, which shows how much the market values every dollar of the company's sales, currently stands at 0.59.
- The company's enterprise value-to-revenue multiple, which is often used to determine a company's valuation in the case of a potential acquisition, currently stands at 0.94.
P/E
7.28
EBITDA
$251M
P/Book
1.95
Mkt Cap
$1B
P/Sales
0.59
Revenue
$2B
EPS (TTM)
4.49
PEG Ratio
0.19
EV/Revenue
0.94
Total Cash
$175M
Debt/Equity
3.30
Forward P/E
13.89
Current Debt
$458M
Gross Profit
$679M
Dividend Date
2022-08-17
Earnings Date
-
Profit Margin
0.03
Revenue/Share
44.75
Total Revenue
$2B
Enterprise Val
$2B
Put/Call Ratio
1.31
Revenue/Employee
539756.81
Market Comparative Performance
- The company's share price is the same as the S&P 500 Index , beats it on a 1-year basis, and beats it on a 5-year basis
- The company's share price is the same as the Dow Jones Industrial Average , beats it on a 1-year basis, and beats it on a 5-year basis
- The company share price is the same as the performance of its peers in the Industrials industry sector , beats it on a 1-year basis, and beats it on a 5 year basis
| Name | DoD %Δ | YTD %Δ | 1 Yr % | 52-Week H % | 52-Week L % |
|---|---|---|---|---|---|
| Griffon Corp. | 4.7 | 16.6 | 43.9 | -0.5 | 89.6 |
| Dow Jones Industrial Average | 0.1 | -8.8 | -5.2 | -9.8 | 11.3 |
| S&P 500 Index | -0.1 | -12.3 | -5.2 | -12.8 | 14.7 |
| Industrials | -0.1 | -12.4 | -12.1 | -13.7 | 15.7 |
Peer Group Comparative Performance
- The company's stock price performance year-to-date beats the peer average by 115.0%
- The company's stock price performance over the past 12 months beats the peer average by 514.4%
- The company's price-to-earnings ratio, which relates a company's share price to its earnings per share, is -39.7% lower than the average peer.
| Name | MKT CAP (USD) | P/E | YTD %Δ | 1 Yr %Δ | 52-Week H % | 52-Week L % |
|---|---|---|---|---|---|---|
| Griffon Corp. | GFF | 7.3 | 16.6 | 43.9 | -0.5 | 89.6 |
| Peer Avg | N/A | 12.1 | 7.7 | 7.1 | -10.7 | 35.6 |
| Lockheed Martin Corp. | LMT | 24.0 | 20.8 | 20.4 | -10.9 | 33.9 |
| Boeing Co. | BA | -18.6 | -18.0 | -28.7 | -31.0 | 47.3 |
| Northrop Grumman Corp. | NOC | 13.0 | 24.3 | 33.5 | -2.7 | 39.9 |
| General Dynamics Corp. | GD | 19.0 | 11.6 | 17.5 | -8.7 | 24.2 |
| Sonoco Products Co. | SON | 14.1 | 6.4 | -0.9 | -7.2 | 19.9 |
| PGT Innovations Inc | PGTI | 20.9 | 1.1 | 0.9 | -3.7 | 48.6 |
This story was produced by the Kwhen Automated News Generator. For more articles like this, please visit us at finance.kwhen.com. Write to editors@kwhen.com. © 2021 Kwhen Inc.
Was this content valuable for you?
Tags: