Nxt-ID Inc Shares Close the Day 12.1% Lower - Daily Wrap
The company saw its shares close the day 12.1% lower than yesterday, with trading volume lower than its 30 day average.
Jan 16, 2022 by Kwhen Finance Editors
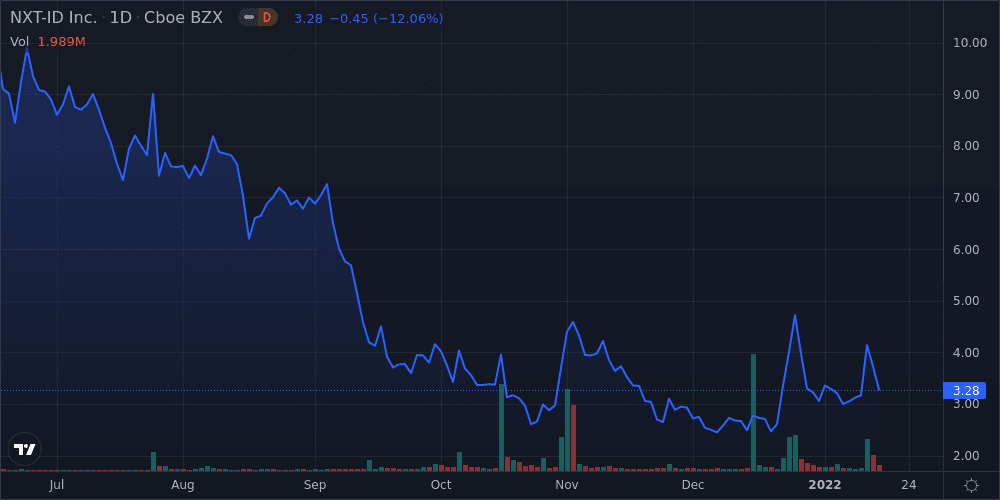
Nxt-ID Inc (NXTD) shares closed today 12.1% lower than it did at the end of yesterday. The stock is currently up 7.2% year-to-date, down 74.8% over the past 12 months, and down 88.2% over the past five years. Today, the Dow Jones Industrial Average fell 0.6%, and the S&P 500 rose 0.0%.
Trading Activity
- Shares traded as high as $4.47 and as low as $2.90 this week.
- Shares closed 90.5% below its 52-week high and 39.6% above its 52-week low.
- Trading volume this week was 59.7% higher than the 10-day average and 57.5% higher than the 30-day average.
- Beta, a measure of the stock’s volatility relative to the overall market stands at 0.0.
Technical Indicators
- The Relative Strength Index (RSI) on the stock was between 30 and 70.
- MACD, a trend-following momentum indicator, indicates a downward trend.
- The stock closed above its Bollinger band, indicating it may be overbought.
Market Comparative Performance
- The company's share price lags the S&P 500 Index today, lags it on a 1-year basis, and lags it on a 5-year basis
- The company's share price lags the Dow Jones Industrial Average today, lags it on a 1-year basis, and lags it on a 5-year basis
- The company share price lags the performance of its peers in the Industrials industry sector today, lags it on a 1-year basis, and lags it on a 5 year basis
| Name | DoD %Δ | YTD %Δ | 1 Yr % | 52-Week H % | 52-Week L % |
|---|---|---|---|---|---|
| Nxt-ID Inc | -12.1 | 7.2 | -74.8 | -89.3 | 57.0 |
| Dow Jones Industrial Average | -0.6 | -1.2 | 18.5 | -3.1 | 22.0 |
| S&P 500 Index | 0.0 | -2.2 | 25.3 | -3.9 | 26.9 |
| Industrials | -0.6 | -1.5 | 14.8 | -3.6 | 20.1 |
Peer Group Comparative Performance
- The company's stock price performance year-to-date beats the peer average by -183.6%
- The company's stock price performance over the past 12 months lags the peer average by 2276.8%
| Name | MKT CAP (USD) | P/E | YTD %Δ | 1 Yr %Δ | 52-Week H % | 52-Week L % |
|---|---|---|---|---|---|---|
| Nxt-ID Inc | NXTD | 0 | 7.2 | -74.8 | -89.3 | 57.0 |
| Peer Avg | N/A | 79.3 | -8.6 | -3.1 | -41.2 | 18.1 |
| Paylocity Holding Corp | PCTY | 121.0 | -16.8 | 3.7 | -36.7 | 29.0 |
| Pitney Bowes, Inc. | PBI | 71.5 | -0.5 | -9.1 | -56.7 | 5.0 |
| Mitek Systems Inc | MITK | 45.4 | -8.5 | -4.1 | -30.1 | 20.5 |
This story was produced by the Kwhen Automated News Generator. For more articles like this, please visit us at finance.kwhen.com. Write to editors@kwhen.com. © 2021 Kwhen Inc.
Was this content valuable for you?
Tags: