Grupo SIMEC SAB de CV Unsponsored ADR Class B Shares Close the Day 11.9% Higher - Daily Wrap
The company saw its shares close the day 11.9% higher than yesterday, with trading volume lower than its 30 day average.
Jan 13, 2022 by Kwhen Finance Editors
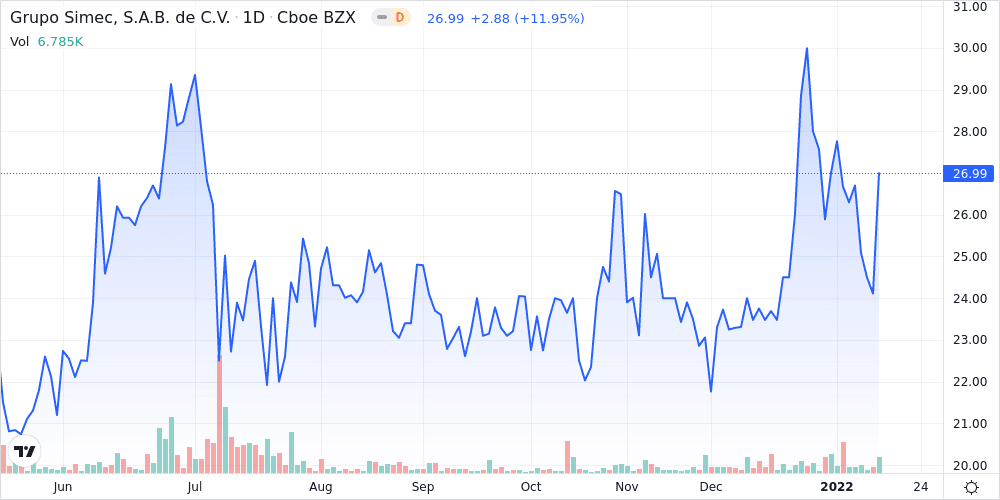
Grupo SIMEC SAB de CV Unsponsored ADR Class B (SIM) shares closed today 11.9% higher than it did at the end of yesterday. The stock is currently down 10.7% year-to-date, up 90.9% over the past 12 months, and up 81.3% over the past five years. Today, the Dow Jones Industrial Average rose 0.1%, and the S&P 500 rose 0.3%.
Trading Activity
- Shares traded as high as $28.86 and as low as $22.97 this week.
- Shares closed 14.9% below its 52-week high and 149.0% above its 52-week low.
- Trading volume this week was 45.4% lower than the 10-day average and 45.5% lower than the 30-day average.
- Beta, a measure of the stock’s volatility relative to the overall market stands at 0.0.
Technical Indicators
- The Relative Strength Index (RSI) on the stock was between 30 and 70.
- MACD, a trend-following momentum indicator, indicates a downward trend.
- The stock closed above its Bollinger band, indicating it may be overbought.
Market Comparative Performance
- The company's share price beats the S&P 500 Index today, beats it on a 1-year basis, and lags it on a 5-year basis
- The company's share price beats the Dow Jones Industrial Average today, beats it on a 1-year basis, and lags it on a 5-year basis
| Name | DoD %Δ | YTD %Δ | 1 Yr % | 52-Week H % | 52-Week L % |
|---|---|---|---|---|---|
| Grupo SIMEC SAB de CV Unsponsored ADR Class B | 11.9 | -10.7 | 90.9 | -22.7 | 126.2 |
| Dow Jones Industrial Average | 0.1 | -0.2 | 18.9 | -1.6 | 23.8 |
| S&P 500 Index | 0.3 | -1.1 | 25.7 | -1.7 | 29.8 |
| Technology Industry | -3.5 | 10.2 | -64.7 | -67.8 | 12.9 |
Peer Group Comparative Performance
- The company's stock price performance year-to-date lags the peer average by -2478.2%
- The company's stock price performance over the past 12 months beats the peer average by 156.3%
| Name | MKT CAP (USD) | P/E | YTD %Δ | 1 Yr %Δ | 52-Week H % | 52-Week L % |
|---|---|---|---|---|---|---|
| Grupo SIMEC SAB de CV Unsponsored ADR Class B | SIM | 0 | -10.7 | 90.9 | -22.7 | 126.2 |
| Peer Avg | N/A | 3.9 | 0.5 | 35.5 | -11.3 | 64.6 |
| ArcelorMittal - New York Shares - Level III | MT | 2.9 | 11.2 | 45.6 | 0.4 | 80.8 |
| Nucor Corp. | NUE | 6.4 | -2.9 | 98.6 | -11.7 | 139.5 |
| Steel Dynamics Inc. | STLD | 5.2 | -1.8 | 55.2 | -15.6 | 87.5 |
| Ternium S.A. - ADR | TX | 2.7 | 6.1 | 49.5 | -15.9 | 91.0 |
| United States Steel Corp. | X | 2.1 | 2.4 | 7.5 | -17.9 | 55.8 |
| Gerdau S.A. - ADR | GGB | 2.4 | 2.6 | 3.7 | -25.0 | 31.6 |
| Commercial Metals Co. | CMC | 10.6 | -0.9 | 68.9 | -5.5 | 90.5 |
| Schnitzer Steel Industries, Inc. - Class A | SCHN | 6.4 | -12.3 | 25.7 | -21.5 | 68.7 |
This story was produced by the Kwhen Automated News Generator. For more articles like this, please visit us at finance.kwhen.com. Write to editors@kwhen.com. © 2021 Kwhen Inc.
Was this content valuable for you?
Tags: