Euronav NV Shares Climb 0.6% Past Previous 52-Week High - Market Mover
The shares rose 0.6% higher than its previous 52-week high of $15.41, with trading volume lower than its 30 day average
Aug 09, 2022 by Kwhen Finance Editors
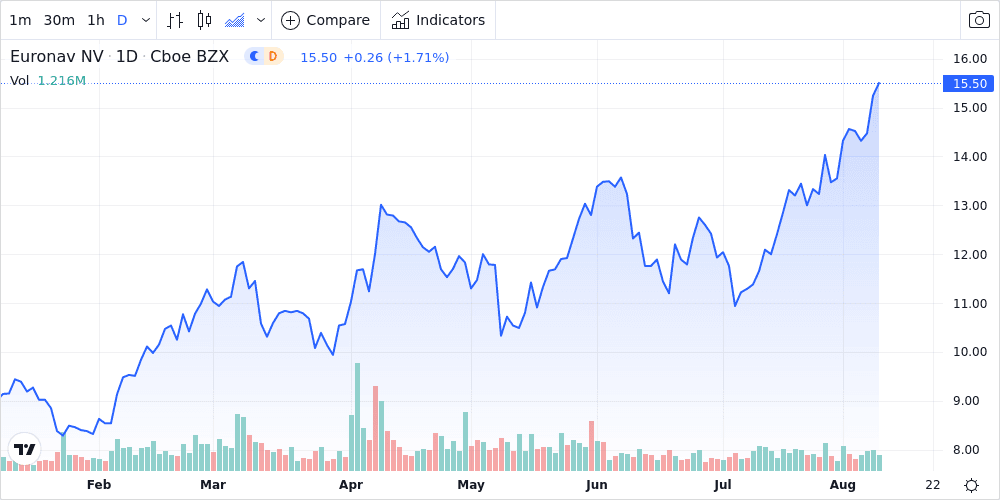
Euronav NV (EURN) shares closed 0.6% higher than its previous 52 week high, giving the company a market cap of $3B. The stock is currently up 72.2% year-to-date, up 90.8% over the past 12 months, and up 144.3% over the past five years. This week, the Dow Jones Industrial Average rose 0.1%, and the S&P 500 rose 0.5%.
Trading Activity
- Trading volume this week was 12.7% higher than the 20-day average.
- Beta, a measure of the stock’s volatility relative to the overall market stands at 0.6.
Technical Indicators
- The Relative Strength Index (RSI) on the stock was above 70, indicating it may be overbought.
- MACD, a trend-following momentum indicator, indicates an upward trend.
- The stock closed below its Bollinger band, indicating it may be oversold.
Market Comparative Performance
- The company's share price is the same as the S&P 500 Index , beats it on a 1-year basis, and beats it on a 5-year basis
- The company's share price is the same as the Dow Jones Industrial Average , beats it on a 1-year basis, and beats it on a 5-year basis
- The company share price is the same as the performance of its peers in the Industrials industry sector , beats it on a 1-year basis, and beats it on a 5 year basis
| Name | DoD %Δ | YTD %Δ | 1 Yr % | 52-Week H % | 52-Week L % |
|---|---|---|---|---|---|
| Euronav NV | 1.7 | 72.2 | 90.8 | -0.3 | 105.9 |
| Dow Jones Industrial Average | 0.1 | -8.7 | -5.0 | -10.3 | 10.8 |
| S&P 500 Index | -0.1 | -12.4 | -5.3 | -13.5 | 13.8 |
| Industrials | -0.1 | -12.4 | -12.2 | -14.3 | 14.8 |
This story was produced by the Kwhen Automated News Generator. For more articles like this, please visit us at finance.kwhen.com. Write to editors@kwhen.com. © 2021 Kwhen Inc.
Was this content valuable for you?
Tags: