Xinyuan Real Estate Co. Ltd. - ADR Shares Close in on 52-Week Low - Market Mover
The shares closed 1.5% above its 52-week low of $0.66, with trading volume higher than its 30 day average
Dec 23, 2021 by Kwhen Finance Editors
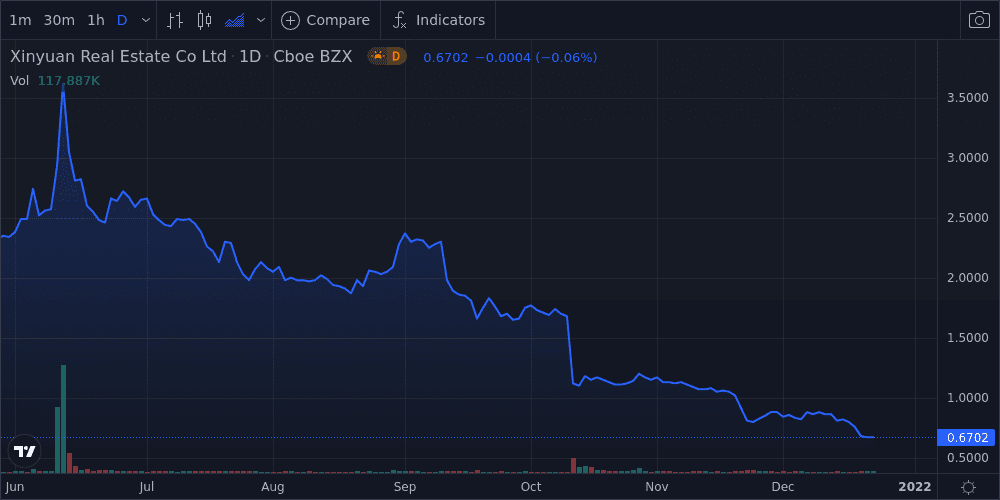
Xinyuan Real Estate Co. Ltd. - ADR (XIN) shares closed today at 1.5% above its 52 week low of $0.66, giving the company a market cap of $35M. The stock is currently down 69.5% year-to-date, down 70.9% over the past 12 months, and down 82.9% over the past five years. This week, the Dow Jones Industrial Average fell 0.5%, and the S&P 500 fell 0.3%.
Trading Activity
- Trading volume this week was 4.9% higher than the 20-day average.
- Beta, a measure of the stock’s volatility relative to the overall market stands at 1.3.
Technical Indicators
- The Relative Strength Index (RSI) on the stock was under 30, indicating it may be underbought.
- MACD, a trend-following momentum indicator, indicates a downward trend.
- The stock closed below its Bollinger band, indicating it may be oversold.
Market Comparative Performance
- The company's share price is the same as the S&P 500 Index , lags it on a 1-year basis, and lags it on a 5-year basis
- The company's share price is the same as the Dow Jones Industrial Average , lags it on a 1-year basis, and lags it on a 5-year basis
| Name | DoD %Δ | YTD %Δ | 1 Yr % | 52-Week H % | 52-Week L % |
|---|---|---|---|---|---|
| Xinyuan Real Estate Co. Ltd. - ADR | -0.1 | -69.5 | -70.9 | -83.7 | 1.5 |
| Dow Jones Industrial Average | 0.7 | 18.9 | 21.1 | -2.6 | 20.8 |
| S&P 500 Index | 1.0 | 26.8 | 29.1 | -1.9 | 28.6 |
| Technology Industry | -3.9 | -65.3 | -66.9 | -68.0 | 8.8 |
Peer Group Comparative Performance
- The company's stock price performance year-to-date lags the peer average by -271.1%
- The company's stock price performance over the past 12 months lags the peer average by -275.9%
| Name | MKT CAP (USD) | P/E | YTD %Δ | 1 Yr %Δ | 52-Week H % | 52-Week L % |
|---|---|---|---|---|---|---|
| Xinyuan Real Estate Co. Ltd. - ADR | XIN | 0 | -69.5 | -70.9 | -83.7 | 1.5 |
| Peer Avg | N/A | 17.6 | 40.6 | 40.3 | -6.5 | 45.5 |
| Jones Lang Lasalle Inc. | JLL | 16.6 | 75.3 | 74.5 | -7.8 | 78.2 |
| Kennedy-Wilson Holdings Inc | KW | 7.2 | 33.5 | 38.4 | -3.6 | 41.3 |
| St. Joe Co. | JOE | 46.4 | 16.3 | 14.7 | -14.5 | 23.1 |
| New England Realty Associates Limited Partnership | NEN | 0 | 37.4 | 33.6 | -0.3 | 39.5 |
This story was produced by the Kwhen Automated News Generator. For more articles like this, please visit us at finance.kwhen.com. Write to editors@kwhen.com. © 2021 Kwhen Inc.
Was this content valuable for you?
Tags: