Norwood Financial Corp. Shares Approach 52-Week High - Market Mover
The shares closed 1.9% below its 52-week high of $28.80, with trading volume higher than its 30 day average
Jan 13, 2022 by Kwhen Finance Editors
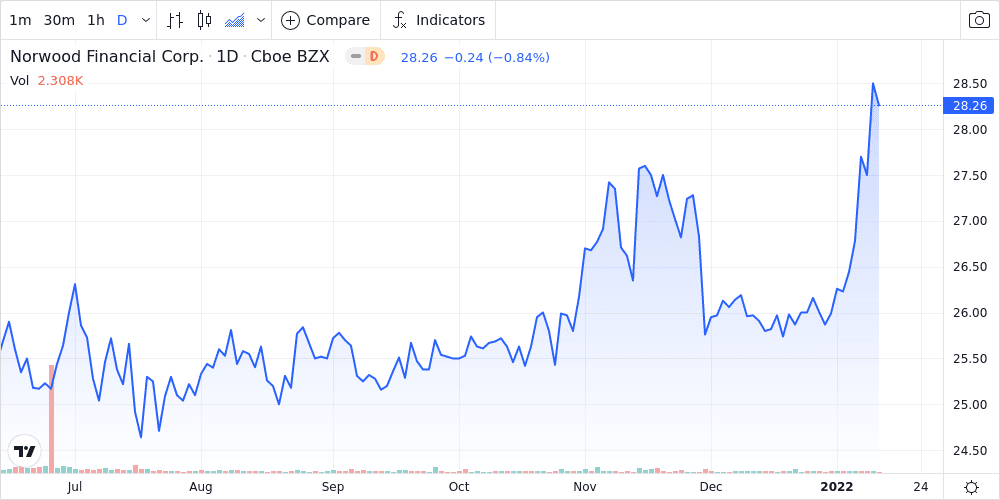
Norwood Financial Corp. (NWFL) shares closed today at 1.9% below its 52 week high of $28.80, giving the company a market cap of $233M. The stock is currently up 9.7% year-to-date, up 11.8% over the past 12 months, and up 134.0% over the past five years. This week, the Dow Jones Industrial Average fell 1.4%, and the S&P 500 fell 1.6%.
Trading Activity
- Trading volume this week was 7.1% lower than the 20-day average.
- Beta, a measure of the stock’s volatility relative to the overall market stands at 0.0.
Technical Indicators
- The Relative Strength Index (RSI) on the stock was above 70, indicating it may be overbought.
- MACD, a trend-following momentum indicator, indicates a downward trend.
- The stock closed above its Bollinger band, indicating it may be overbought.
Market Comparative Performance
- The company's share price is the same as the S&P 500 Index , lags it on a 1-year basis, and beats it on a 5-year basis
- The company's share price is the same as the Dow Jones Industrial Average , lags it on a 1-year basis, and beats it on a 5-year basis
- The company share price is the same as the performance of its peers in the Financials industry sector , lags it on a 1-year basis, and beats it on a 5 year basis
| Name | DoD %Δ | YTD %Δ | 1 Yr % | 52-Week H % | 52-Week L % |
|---|---|---|---|---|---|
| Norwood Financial Corp. | -0.8 | 9.7 | 11.8 | -1.0 | 27.7 |
| Dow Jones Industrial Average | 0.1 | -0.2 | 18.9 | -1.6 | 23.8 |
| S&P 500 Index | 0.3 | -1.1 | 25.7 | -1.7 | 29.8 |
| Financials | 0.0 | 5.3 | 35.2 | 0.3 | 42.9 |
Peer Group Comparative Performance
- The company's stock price performance year-to-date beats the peer average by 85.2%
- The company's stock price performance over the past 12 months lags the peer average by -79.1%
| Name | MKT CAP (USD) | P/E | YTD %Δ | 1 Yr %Δ | 52-Week H % | 52-Week L % |
|---|---|---|---|---|---|---|
| Norwood Financial Corp. | NWFL | 0 | 9.7 | 11.8 | -1.0 | 27.7 |
| Peer Avg | N/A | 9.6 | 5.2 | 56.6 | -3.7 | 71.1 |
| Customers Bancorp Inc | CUBI | 9.1 | 8.7 | 224.3 | -6.2 | 240.5 |
| S & T Bancorp, Inc. | STBA | 11.8 | 6.4 | 26.7 | -4.0 | 38.6 |
| Tristate Capital Holdings Inc | TSC | 21.8 | 6.9 | 63.9 | -0.7 | 88.9 |
| Univest Financial Corp | UVSP | 9.1 | 4.0 | 39.0 | -1.4 | 46.8 |
| CNB Financial Corp (PA) | CCNE | 10.1 | 4.9 | 25.6 | -1.9 | 41.8 |
| Citizens & Northern Corp | CZNC | 14.4 | 4.2 | 37.9 | -2.4 | 49.1 |
| Mid Penn Bancorp, Inc. | MPB | 0 | 3.9 | 41.9 | -2.3 | 64.4 |
| ACNB Corp. | ACNB | 0 | 8.6 | 34.1 | -1.2 | 46.4 |
| Orrstown Financial Services, Inc. | ORRF | 7.8 | -0.3 | 41.6 | -2.6 | 50.3 |
| Republic First Bancorp, Inc. | FRBK | 11.8 | 4.8 | 30.9 | -14.8 | 44.0 |
This story was produced by the Kwhen Automated News Generator. For more articles like this, please visit us at finance.kwhen.com. Write to editors@kwhen.com. © 2021 Kwhen Inc.
Was this content valuable for you?
Tags: